Dashboard Catalogue Web Application
👉 Access the Monitoring Dashboard Catalogue here.
1. What is the Dashboard Catalogue?
The Dashboard Catalogue is a web tool that allows you to import dashboards from other Grafana organizations — and share your own dashboards with others.
It helps you discover available dashboards, preview them, and import them with just a few clicks. The tool also guides you through configuring any required data sources, so everything works seamlessly in your environment.
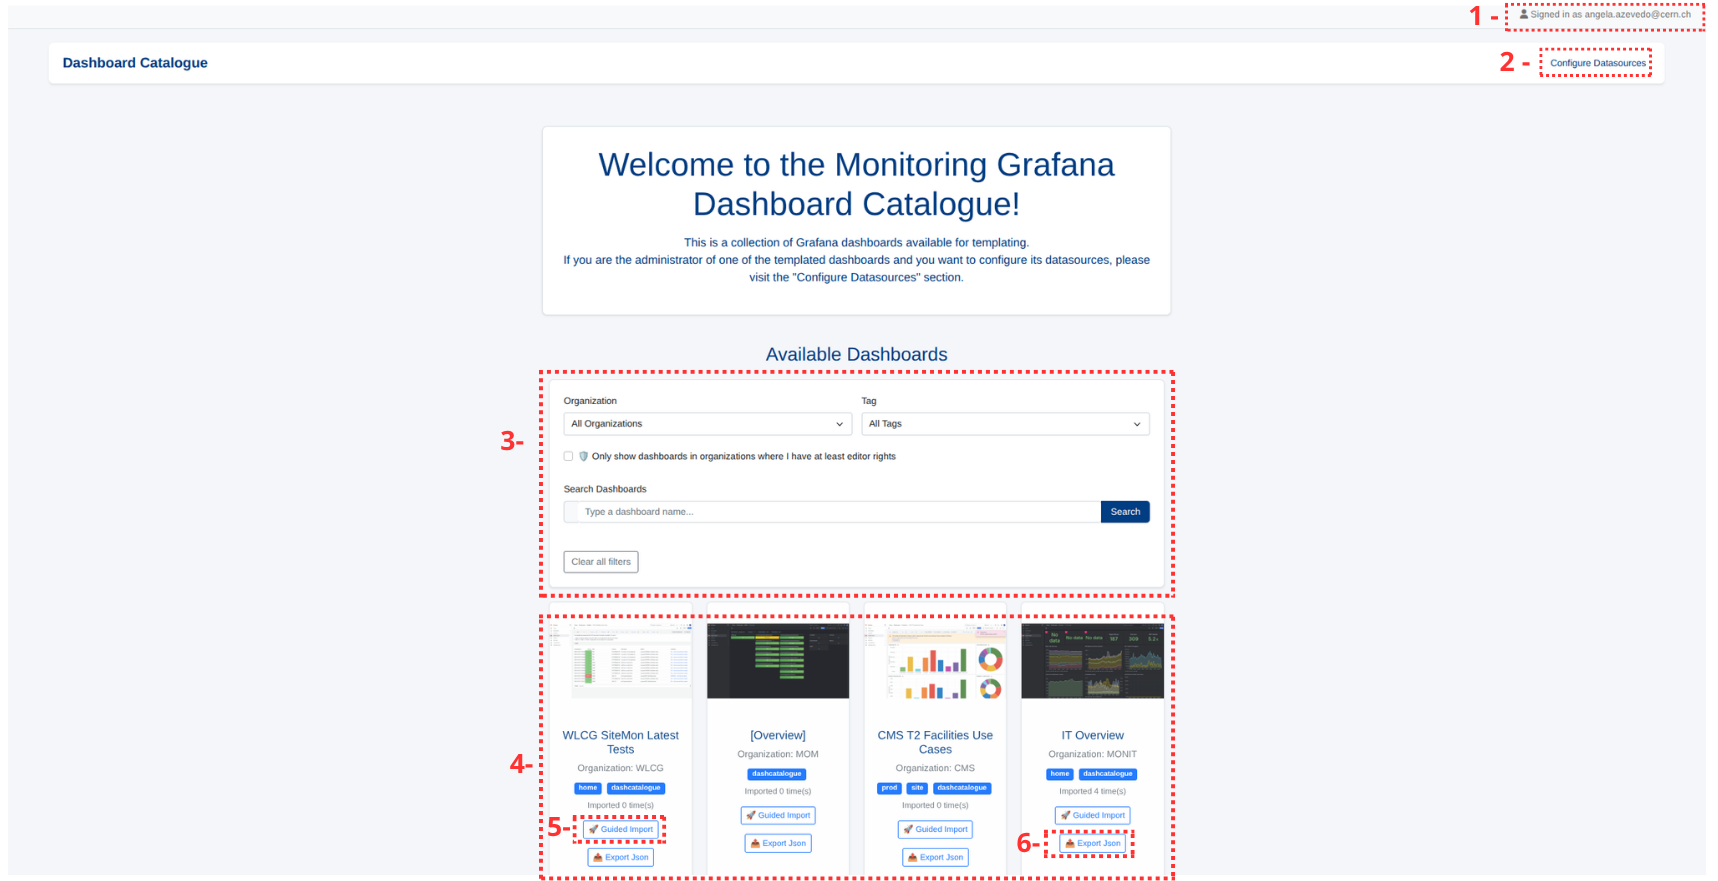
Image Guide – Understanding the Dashboard Catalogue Interface
-
Logged user email.
-
Configure Data Sources: This button is available only to organization admins. It lets you configure or manage shared data sources that dashboards may depend on.
-
Filters and Search bar: It allows you to find available dashboadrs for import.
- Filters narrows results by:
- Organization
- Tags
- Optional: Show only dashboards in organizations where you have editor rights or higher.
- 👉 Learn more in How do I find a dashboard?.
- Search Bar: Type part of the dashboard name and press
Search. - Clear all filter: Click this to reset all filters and see the full list of dashboards again.
Note
You can combine any filters, use just one, or leave them empty to browse everything.
-
Dashboard Cards
- Each dashboard displays its name, organization, tags, and a preview image.
- To expand the dashboard preview image to its full-size, you can click on the image.
- On its card you will have also the following action buttons: Guided Import (recommended) and Export JSON.
-
Guided Import
- Starts a step-by-step process to import the dashboard into your Grafana organization. Ideal for most users.
-
Export JSON
- Downloads the dashboard as a
.jsonfile. You can import it manually into Grafana using the native import function.
- Downloads the dashboard as a
2. How do I find a dashboard?
Note
You can find a dashboard available for importing by going through the filters.
- Organization: Here you can filter by a Grafana organizations with dashboards available for importing.
- Tag: Here you can filter by a Dashboard Tag that is present in dashboards available for importing.
- Checkbox - Only show dashboards in organizations where I have at least editor rights: This is quite useful if you want to see all dashboards available for importing in your organization.
- Search Dashboards bar: Here you can filter the catalogue by a dashboard name.
3. How do I import a dashboard into my organization?
1. Guided Import (recommended)
When to use it?
Use this option if you want to reuse data sources from the source dashboard and/or keep your dashboard in sync with changes to the source dashboard.
How does synchronization work?
-
Automatic Synchronization:
If the content of the source dashboard changes (for example, panels are added or updated) but the data sources remain the same, your imported dashboard will be automatically updated to match the source.Note
This will overwrite any modifications you made to the imported dashboard.
-
If data sources change:
If the data sources in the source dashboard are changed, automatic synchronization will stop. A warning banner will appear, and you will need to manually re-import the dashboard to update the data source mappings.Note
This requires user action and is not automatic.
How to use it?
- Step 1: In the main page, choose a dashboard and then click on [
🚀 Guided Import]. - Step 2: Select the target organization where you want to place the new dashboard. You need to have at least editor rights in an organization to import using the tool.
- Step 3: Select a new dashboard title or leave it blank to keep the original name.
- Step 4: Select the folder where you want to save the dashboard. If
rootis selected, the dashboard will be saved at the top level (outside any folder). - Step 5: Review and configure required data sources:
- Depending on how the dashboard was originally configured, you may encounter one of the following situations:
- Case A: The data source is shared
- Reuse Existing: Use the same data source as in the template (this option only shows up if it's shared).
- Select/Create New: Choose an existing data source in the target organization or create a new one (If you choose to create a new one, after the creation you will need to press the
Refresh optionsbutton). - Case B: The data source is non-shared
- Add Credentials: Provide new credentials for the data source. For example for data sources from monitoring team connection parameters other than user and password are always the same.
- Select/Create New: Choose an existing data source in the target organization or create a new one (If you choose to create a new one, after the creation you will need to press the
Refresh optionsbutton). - Case C: No data source was configured by the owner
- Select/Create New: Choose an existing data source in the target organization or create a new one (If you choose to create a new one, after the creation you will need to press the
Refresh optionsbutton).
- Step 6: Confirm your selections and proceed.
- Step 7: Review your selections and if everything is right, you can proceed with the dashboard creation by clicking on
Create Dashboard.
2. Manual JSON Export/Import
When to use it?
Use this option if you want to fully control the imported dashboard and prevent it from being updated when the source dashboard changes. This is useful for long-term customization or when you don’t want to rely on template updates.
How to use it?
- Step 1: In the main page, choose a dashboard and then click on [
📤 Export Json]. The JSON file of the dashboard will be downloaded. - Step 2: Go to your Grafana Organization > Dashboards > Click on
Newbutton on the top right corner of the page > Import. - Step 3: Paste your JSON content into the
Import via dashboard JSON modelfield and then click onLoad. - Step 4: Optionally give it a new name, then select the appropriate data sources for your environment.
4. How do I share a dashboard with others?
Follow these steps to make your dashboard available in the Dashboard Catalogue so others can import it:
- Step 1: Open Grafana and go to the organization where your dashboard is located.
- Step 2: In the left-hand menu, click on Dashboards, then open the dashboard you want to share.
- Step 3: Go to Dashboard Settings → General → Tags.
- Step 4: Add a new tag
dashcatalogue. - Step 5: Save the dashboard.
- Step 6: Wait for your dashboard to appear in the Catalogue (this can take up to 10 minutes).
Note
Don't forget to configure the data sources in the application as well. This step makes the data sources used in your dashboard available for others to reuse. Once you've added the dashcatalogue tag, continue with How do I configure my data sources as shared/non-shared? to complete the setup.
5. What’s the difference between shared and non-shared data sources?
Shared Data Sources
Shared data sources are shared and reusable. When a dashboard uses a shared data source, anyone who imports that dashboard will automatically use the same data source — no credentials are required during import.
Use shared data sources for shared services where access is common across organizations or teams.
Non-shared Data Sources
Non-shared data sources are not shared. When importing a dashboard that uses a non-shared source, users must manually provide credentials or create a new data source in their own organization.
Use non-shared sources for private or sensitive systems where each team must manage their own access.
Example
A shared Prometheus instance configured by an admin can be marked as shared — it’s reused automatically by anyone importing the dashboard. In contrast, a private database should be non-shared, so each user importing the dashboard must enter their own credentials and connection details.
6. How do I configure my data sources as shared/non-shared?
Note
This is only available to users with admin role in at least one organization.
- Step 1: On the main page, click on Configure Data Sources (top left). Again,this option only appears if you have an admin role in at least one organization.
- Step 2 - Select organization: Choose the organization where the dashboard is located and where you want to configure the data sources.
- Step 3 - Set Each Data Source: For listed data sources:
- Mark it as shared if it should be shared with users importing the dashboard.
- If shared, you can optionally provide a password or credentials.
- Leave it non-shared if each user should provide their own credentials.
- You can configure multiple sources in a batch; previous selections remain available.
- Step 5: Save the configurations once all desired data sources are set.
7. What if something goes wrong?
If something doesn’t work as expected, the application will display clear error messages to help you identify the issue.
If you need further assistance, please create a SNOW ticket and include any relevant details or screenshots to help us resolve the issue quickly.