Grafana Organizations
The central Grafana instance is split into different organizations, usually an organizations is linked to a service (MONIT, FTS, CONFIG...) but it can have higher granularity (WLCG, ATLAS, CMS...). Grafana organizations allow the Organization admins to do further split into Folder and Dashboards, enabling the possibility to customise ACLs at those levels.
Requesting an Organization
As a user you can request a new Organization to be created via SNOW, please provide there the following information:
- Organization name
- Admin e-group
- Access level (see below)
Different kinds of Organization
We do offer different "flavours" for organizations, each of them will have its own way of synchronising users, you can find the current list here:
- Public: Any existing Grafana user will be added as viewer for the organization by default
- CERN Only: Any existing Grafana user registered with a
@cern.chSSO account will be added as viewer for the organization. Strict policy of removing any manually added non-CERN user can be requested - Private: Only the "admin" egroup will be added as Admins for the organization by default, new users can then be added by these admins using the e-group integration or manually
- E-Group: Only users available in Teams linked to an e-group will stay in the organization (users leaving the e-groups will be automatically removed)
Managing the Organization
Once you have your Grafana organization set up you can start managing different bits of it Users, Teams, Dashboards, Datasources... We do recommend to get familiarised with these concepts by reading the official Grafana documentation.
However there are few CERN specific implementation that will be interesting for you as an Admin and we will cover them in the next subsections.
Egroup integration
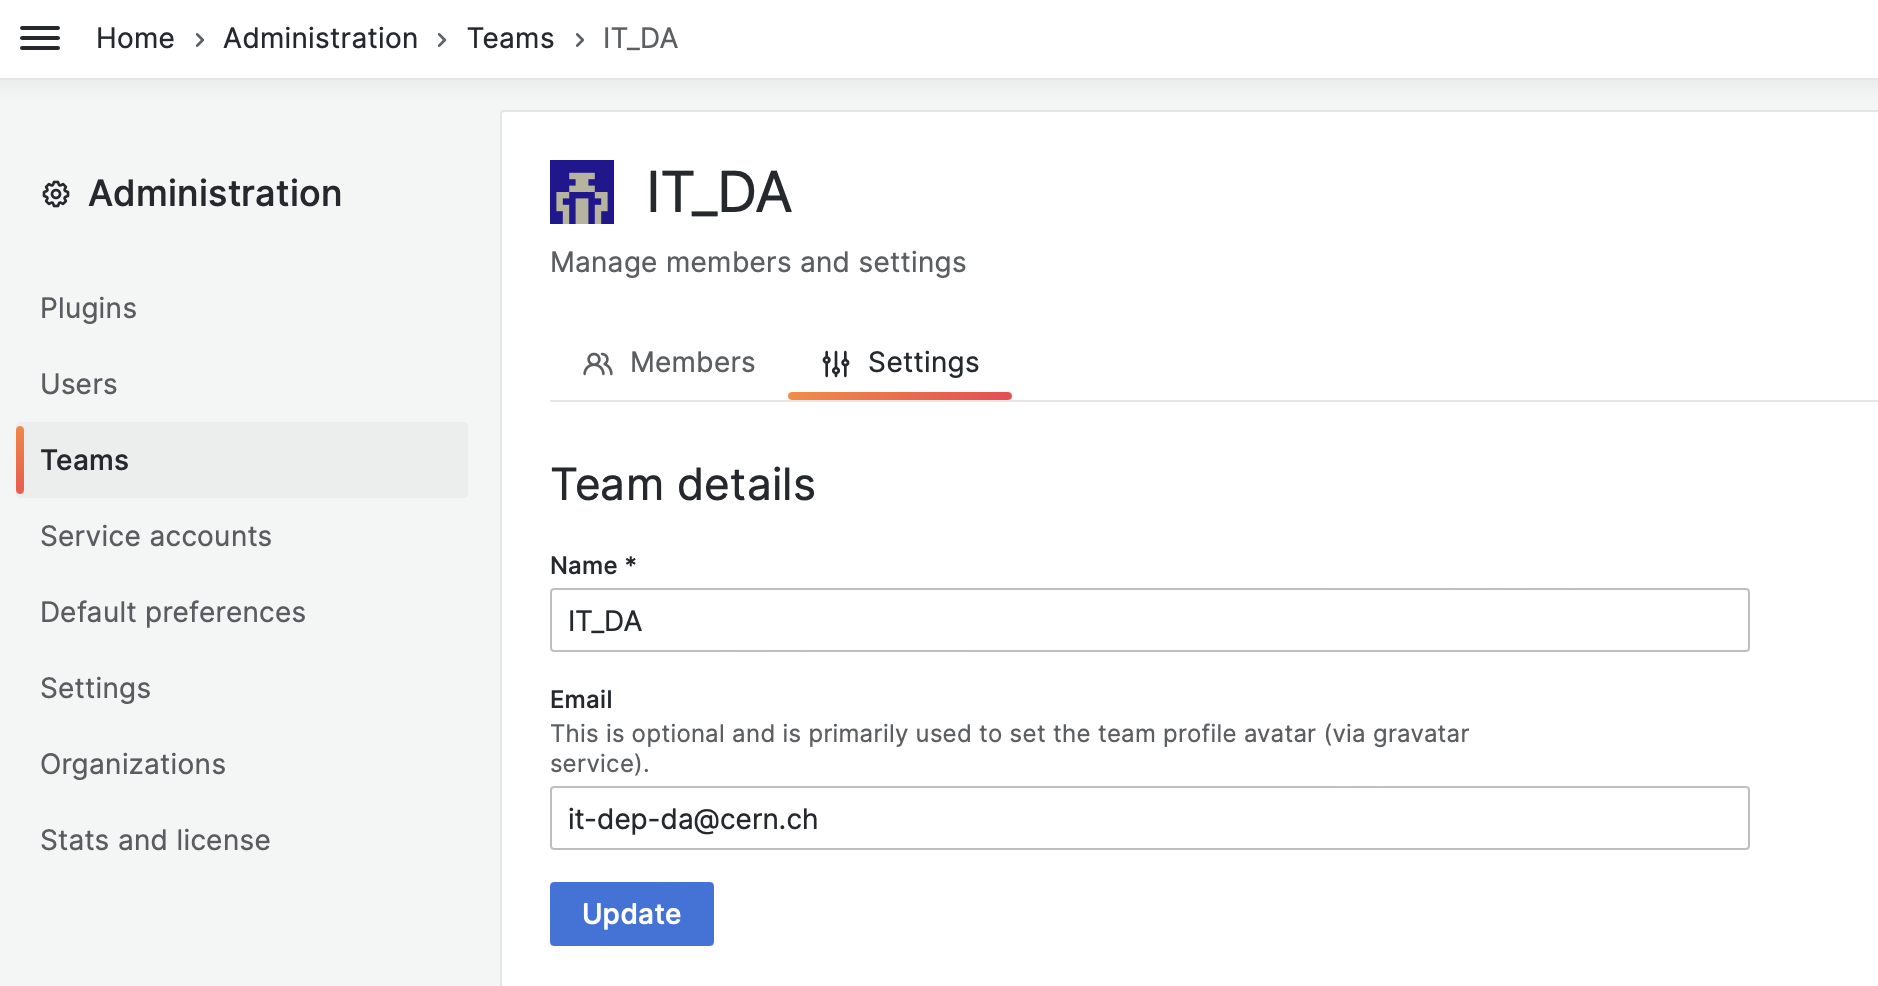
In order to facilitate adding members into the teams, MONIT integrated them with CERN e-groups that allows members synchronization. It is very easy to link your Grafana Team to a CERN e-group by just setting the Team email pointing to the e-group one (e.g. it-dep-da@cern.ch), as depicted below. Once Grafana Team is linked to an e-group, all the active MONIT Grafana users who are also members of that e-group will be added into the team and the corresponding organization, if not already there. The process is continuous and any update of e-group membership will take effect in Grafana with the next execution of the synchronization job (within 30 minutes).
NOTE:
- Once team is linked to an e-group, the latter becomes the source of members, and any user added manually to the team will be removed if not in the corresponding e-group. Users will not be removed from the organization if not team members anymore. This could be enforced by switching the organization to the E-Group Access Level as described above.
- This feature is intended to be used for small and medium-sized teams. Please note that there is currently limit of using e-groups with more than 1000 members.
MONIT managed datasources
In the case that you want to visualise data sent to the central MONIT infrastructure, here's a template for the datasources creation that you can use by customising the credentials.
Prometheus datasource
- URL:
https://monit-prom-lts.cern.ch/prometheus/ - Basic auth: enabled
- User:
tenant - Password: Check the tbag service
- Manage alerts via Alerting UI: disabled
Opensearch datasource
- URL:
https://<cluster>.cern.ch:443/os - Valid clusters are:
monit-timber(public logs),monit-timberprivate(private logs),monit-opensearch(shor-term metrics),monit-opensearch-lt(long-term metrics) - Basic auth: enabled
- User:
<tenant>_ro - Password: Check the tbag service
- Index name:
[monit_*_<tenant>_*]if not OTLP, otherwise[otlp-logs_<tenant>_*] - Pattern:
Daily(most of the cases) - Time field name:
metadata.timestampif not OTLP, otherwisetime(unless you need to plot by some other specific field)
Important: MONIT team recommends the usage of the Opensearch datasource over the Elasticsearch one for connection to Opensearch clusters
InfluxDB datasource
- URL: Depends on the data you want to access, so you will need to ask the MONIT team
- Basic auth: enabled
- User:
<producer>_ro - Password: Check the tbag service
- Database:
monit_production_<producer>
Grafana Service Accounts
Under Grafana there's the concept of service accounts, this will allow organization admins to generate tokens with different access levels to use the Grafana API.
Please note each organization admin should take care of managing the service accounts tokens lifecycle and make sure they are properly handled by the users.