Welcome to Puppet Monit Agent
The Puppet Monit Agent is a collection of open-source software tools configured to gather metrics and logs from Puppet-managed nodes and forward them to CERN’s centralized monitoring infrastructure. By default, it is set up to collect key metrics on node performance (such as CPU, memory, and disk usage) and logs from the system’s Syslog, providing a baseline level of monitoring for all managed nodes.
The Monit Agent is built on a stack that includes Fluent Bit, Prometheus-style metrics, Syslog, and the OpenTelemetry protocol. Fluent Bit serves as the core processing component, gathering metrics through a Prometheus-like interface and capturing logs from Syslog. It then forwards this data to CERN’s monitoring endpoints using the OpenTelemetry protocol. The use of Prometheus-style metrics as an interface allows for flexibility, as it enables users to customize Fluent Bit to scrape or receive additional metrics beyond the default set, adapting monitoring to specific needs.
Monit Agent Architecture
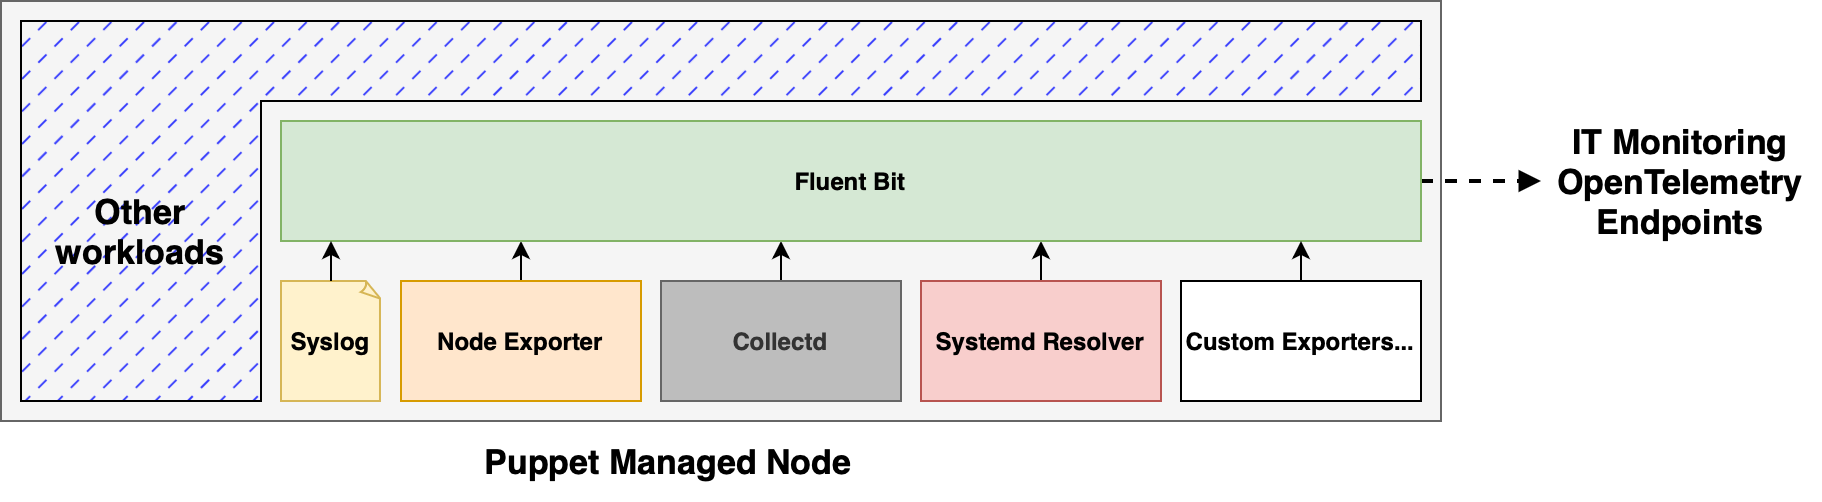
The Monit Agent architecture is composed of several components that work together to collect, process, and export telemetry data from each node.
-
Syslog: Captures logs from system services and applications, providing important information on events and issues occurring on the node. These logs are collected and forwarded by Fluent Bit to the centralized monitoring infrastructure.
-
Node Exporter: Gathers essential system metrics, such as CPU, memory, disk, and network statistics, to provide insights into the overall health and performance of the node. Fluent Bit consolidates these metrics and forwards them to the monitoring endpoints.
-
Collectd: Allows for the preservation of plugins developed by various service managers, enabling them to maintain specific metrics collection functionality while still integrating into the new monitoring ecosystem. This is useful for specialized metrics collection that is not covered by the default set.
-
Custom Exporters: These are configurable components used to collect metrics from unique or specialized applications. They allow users to extend monitoring capabilities to cover custom workloads on the node.
-
Fluent Bit: Acts as the central processing and forwarding layer. It collects metrics from Node Exporter, logs from Syslog, and data from Collectd and Custom Exporters. Fluent Bit standardizes and processes this data before sending it to central IT Monitoring endpoints via OpenTelemetry. By default the monit agent collects and forwards metrics to the default monitoring infrastructure every 10s.
Through this architecture, the Monit Agent enables efficient and customizable monitoring across all Puppet-managed nodes, with the flexibility to meet specific service and application monitoring requirements.
Configuration
MONIT agent has many different configuration options and so, they won't be fully covered in here and instead the recommendation is to check the monitoring module interface.
There's one specific config that we deem important, which is to set up your main tenant. For this, you will just need to override a hiera configuration variable as follows:
And make sure the password is available in teigi for Puppet to retrieve it with the key: "monit_mytenant_password".
Monit Agent Maintained Packages
In order to ensure all the people get the same version for packages related to the Monit Agent tooling, the Monitoring team provides and maintains certain packages that are distributed via Koji.
- monit-fluent-bit: a CERN local build of fluent-bit package with a fixed version and some extra patches
- node-exporter: a CERN local build of node-exporter package
- prometheus: a CERN local build of prometheus
- monitctl: a CERN builtin CLI tool to gather information from monit-agent config
Installing Prometheus package using Puppet module
Although not documented in the module itself, you can install the MONIT provided Prometheus package directly from there, it will require to override some default paths as the package will install the components in different ones.
To install and use Prometheus using the package install method, ensure that you override the default paths as follows:
prometheus::install_method: "package"
prometheus::shared_dir: "/usr/local/prometheus"
prometheus::bin_dir: "/usr/bin"
monitctl Tool
monitctl is a command-line interface (CLI) tool designed for inspecting
CERN's IT monitoring agents, specifically Fluent Bit and Node Exporter.
It provides a unified interface to check service statuses, inspect
configurations, and query Prometheus metrics scraped by the agents.
This can be used as a successor of collectdctl.
Full documentation can be found on its own repo README file.